Visualforce charting is in pilot. To enable this feature you need to contact salesforce.com. At this time it is not recommended that this feature be used in production code or managed packages.
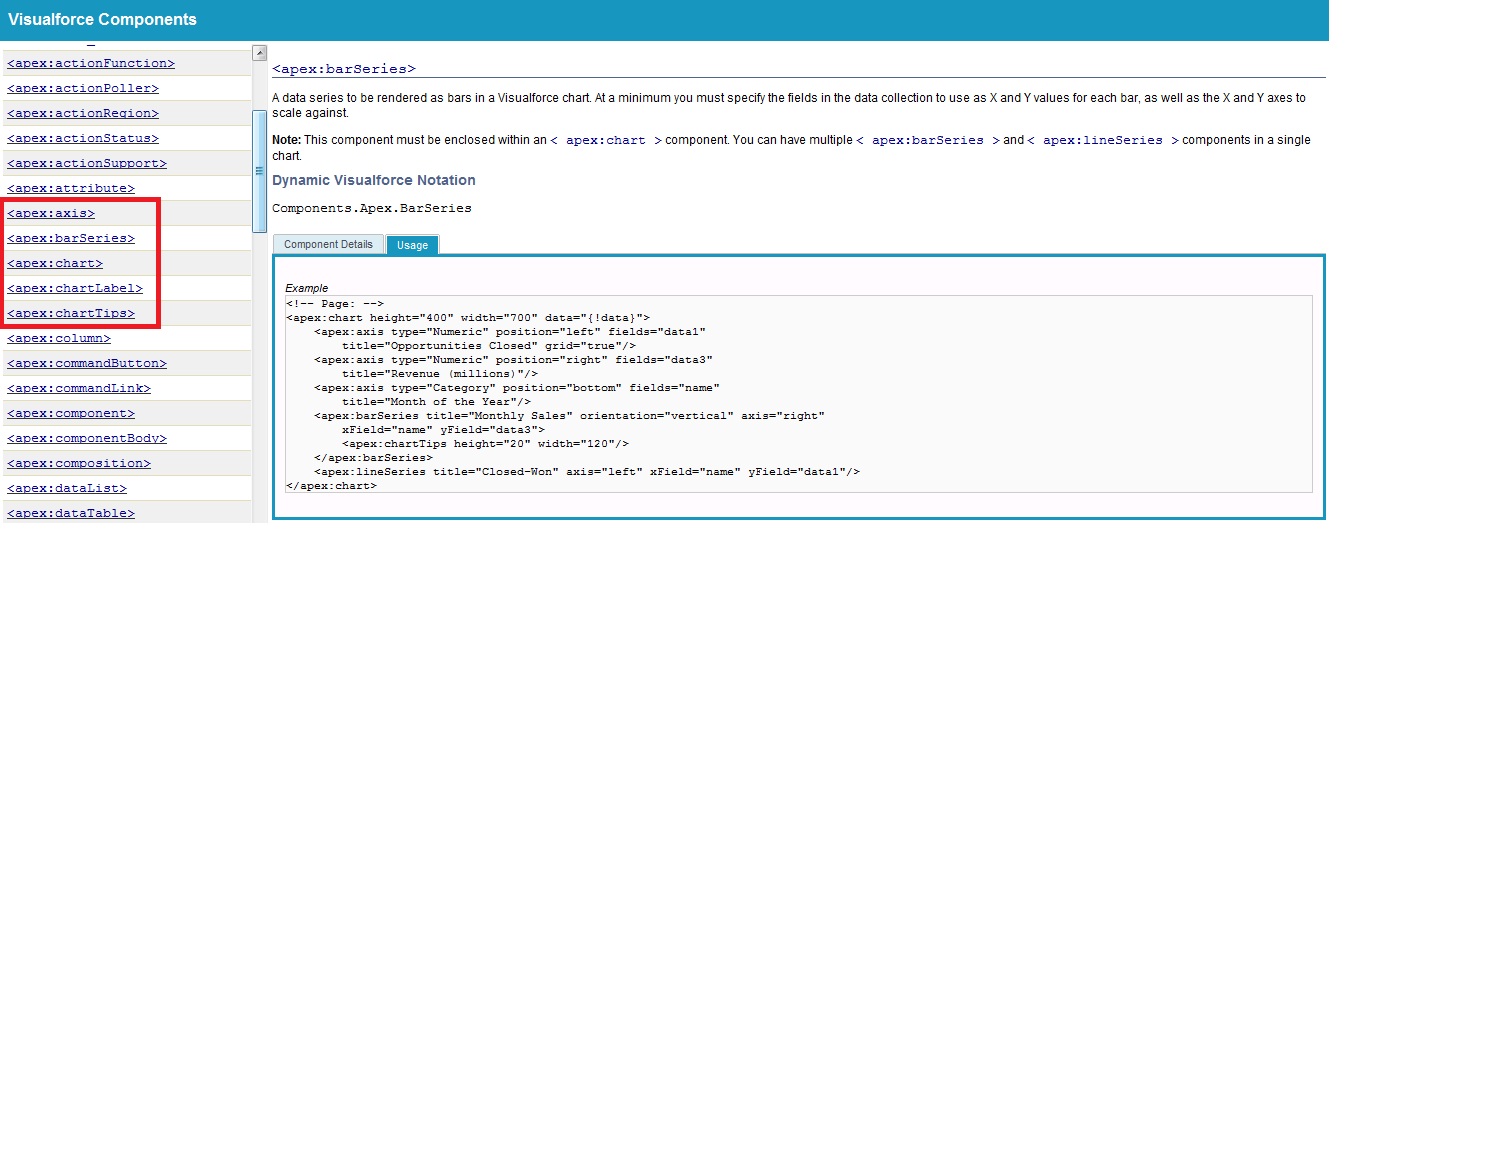
After enabling visualforce charting you are able to see the components in "Component Reference" which are used to create visualforce charts.
Right now if we need to display chart (pie,line,bar etc) we go for google charts, any charts or any third party charts. But with winter 12 release visualforce charting (pilot) is a way for you to create custom charts on your Visualforce pages(pie, bar, and line charts). Visualforce charts are rendered client-side using JavaScript. This allows charts to be animated and visually exciting, and chart data can load and reload asynchronously, which can make the page feel more responsive.
Right now visualforce charting offers variations on bar, line, and pie charts but if you like to use other charts then you can go with Google Charts
Limitations (As it is in pilot there are some limitation too)
- Visualforce charts will only render in browsers which support scalable vector graphics (SVG).
- Visualforce charting uses JavaScript to draw the charts. These charts won't display in pages rendered as PDFs.
- Email clients do not generally support JavaScript execution in messages. Don't use Visualforce charting in email messages or email templates.
- Visualforce charting sends errors and messages to the JavaScript console. You'll want to keep a JavaScript debugging tool, such as Firebug, active during development.
Creating a chart with Visualforce will require you to do two things:
- Write an Apex method that queries for, calculates, and wraps your chart data to send to the browser.
- Define your chart using the Visualforce charting components.
When the page containing the chart loads, the chart data is bound to a chart component, and the JavaScript that will draw the chart is generated. When the JavaScript executes, the chart is drawn in the browser. A Visualforce chart requires that you create a chart container component, which encloses at least one data series component.
Here is the simple example of using Pie Chart :
VFP :
<apex:page controller="PieChartController" title="Pie Chart">

    <apex:chart height="350" width="450" data="{!pieData}">
        <apex:pieSeries dataField="data" labelField="name"/>
        <apex:legend position="top"/>
    </apex:chart>

</apex:page>
Class :
public class PieChartController
{
    //For Pie Chart
    public List<PieWedgeData> getPieData()
    {
        List<PieWedgeData> data = new List<PieWedgeData>();
        data.add(new PieWedgeData('Jan', 30));
        data.add(new PieWedgeData('Feb', 15));
        data.add(new PieWedgeData('Mar', 10));
        data.add(new PieWedgeData('Apr', 20));
        data.add(new PieWedgeData('May', 20));
        data.add(new PieWedgeData('Jun', 5));
        return data;
    }

    // Wrapper class for Pie Chart
    public class PieWedgeData
    {
        public String name { get; set; }
        public Integer data { get; set; }

        public PieWedgeData(String name, Integer data) {
            this.name = name;
            this.data = data;
        }
    }
}
Resulting page looks like this :
Example of more complex Charts :
VFP :
<apex:page controller="ChartController">
    <apex:chart height="400" width="700" data="{!data}">
        <apex:legend position="right"/>
        <apex:axis type="Numeric" position="left" fields="data1"
            title="Opportunities Closed" grid="true"/>
        <apex:axis type="Numeric" position="right" fields="data3"
            title="Revenue (millions)"/>
        <apex:axis type="Category" position="bottom" fields="name"
            title="Month of the Year">
            <apex:chartLabel rotate="315"/>
        </apex:axis>
        <apex:barSeries title="Monthly Sales" orientation="vertical" axis="right"
            xField="name" yField="data3">
            <apex:chartTips height="20" width="120"/>
        </apex:barSeries>
        <apex:lineSeries title="Closed-Won" axis="left" xField="name" yField="data1"
            fill="true" markerType="cross" markerSize="4" markerFill="#FF0000"/>
        <apex:lineSeries title="Closed-Lost" axis="left" xField="name" yField="data2"
            markerType="circle" markerSize="4" markerFill="#8E35EF"/>
    </apex:chart>
</apex:page>
Class :
public class ChartController {
    // Return a list of data points for a chart
    public List<Data> getData() {
        List<Data> data = new List<Data>();
        data.add(new Data('Jan', 30, 90, 55));
        data.add(new Data('Feb', 44, 15, 65));
        data.add(new Data('Mar', 25, 32, 75));
        data.add(new Data('Apr', 74, 28, 85));
        data.add(new Data('May', 65, 51, 95));
        data.add(new Data('Jun', 33, 45, 99));
        data.add(new Data('Jul', 92, 82, 60));
        data.add(new Data('Aug', 87, 73, 45));
        data.add(new Data('Sep', 34, 65, 55));
        data.add(new Data('Oct', 78, 66, 56));
        data.add(new Data('Nov', 80, 67, 53));
        data.add(new Data('Dec', 17, 70, 70));
        return data;
    }

    // Wrapper class
    public class Data {
        public String name { get; set; }
        public Integer data1 { get; set; }
        public Integer data2 { get; set; }
        public Integer data3 { get; set; }
        public Data(String name, Integer data1, Integer data2, Integer data3) {
            this.name = name;
            this.data1 = data1;
            this.data2 = data2;
            this.data3 = data3;
        }
    }
}
Resulting page looks like this :
As it is in pilot, so will soon come up with more real time examples and scenarios, stay tuned.
More Reference :
Quick Look at Visualforce Charting
Building a Complex Chart with Visualforce Charting
How Visualforce Charting Works