Showing posts with label release. Show all posts

Jun 30, 2014

Summer 14 Release - Developer Must Know These

So Summer 14 release is almost there and in few more days it will be in our organizations. So are we ready to us the new features/changes?


Let's go through some points which a developer must know, to write Apex/VFP in better way. 

List is as follows :

1) Attach upto 25 MB of files now with objects, earlier it was 5 MB. But, attachment limits in Salesforce Knowledge remain unchanged. So go on and use large data files.

2) Limits for all Apex describe calls have been removed for all API versions. Describe calls include describes for sObjects, fields, field sets, child relationships, picklists, and record types. In other words say no to, ONLY? 100 fields or fieldsets or objects. Yes now we are free :-)


Will these be now needed?

- getLimitChildRelationshipsDescribes()
- getLimitFieldsDescribes()
- getLimitFieldSetsDescribes()
- getLimitPicklistDescribes()
- getLimitRecordTypesDescribes()

3) The Limits methods for script statements have been removed but are available and deprecated in API version 30.0 and earlier. Because the script statement limit is no longer enforced in any API version since Winter ’14, the associated Limits methods are no longer needed. Now no need of getScriptStatements() and getLimitScriptStatements()

4) Now you can create price book entries for standard and custom price books in Apex tests. Previously we were not able to create price book entries and for that we've to use @isTest(seeAllData = true) annotation. So now we can create custom pricebook along with the pricebook entries in test classes itself. Now we can

- Query for the ID of the standard price book in organization with the Test.getStandardPricebookId() method.
- Create test price book entries with standard prices by using the standard price book ID that’s returned by Test.getStandardPricebookId().
- Create test custom price books, which enables you to add price book entries with custom prices.

5) Run future methods with higher limits, unbelievable isn't it? But currently it's in pilot. By this we can avoid reaching governor limits and we can double or triple the capacity of resources like for heap size we can write this @future(limits='2xHeap'), for SOQL @future(limits='2xSOQL') and so on. Fascinating isn't it, eagerly waiting for this to be implemented completely.


6) Chatter in apex. Lot of stuff in this, and difficult to summarize it here would recommend to read release notes.

7) API request in developer edition was 5,000 and now it's raised to 15,000. So now we can do some real time testing along with development.

Lot of stuff to be improved in current code and am on it, are you?

Nov 27, 2011

Social Contacts - Winter'12 Feature


Social Contacts - an awesome feature of winter'12. With Social Contacts you can view contact's social network profile in salesforce with just BUTTON CLICKS.


Some key points :


1) Easy access to contact's information, which indeed help in building strong relationships
2) Can view social information from several networks like "Twitter" , "Facebook" , "LinkedIn" (beta) etc
3) Saves time to login to other sites and view the information


To setup Social Contacts go to Setup > App Setup > Customize > Social Contacts > Settings > Enable all and click Save. We are ready to go.


Steps to follow :


1) Go to any contact


2) Click on Twitter icon 


3) Click "Sign in to Twitter"


4) It will show you the page with possible match
5) Select a profile, it will show the details of thr profile. Isn't that awesome?
To check the Security and Privacy when using Social Contacts, please refer : Social Contact Overview

Visualforce Charting - Winter 12 (Pilot)

Visualforce charting is in pilot. To enable this feature you need to contact salesforce.com. At this time it is not recommended that this feature be used in production code or managed packages.


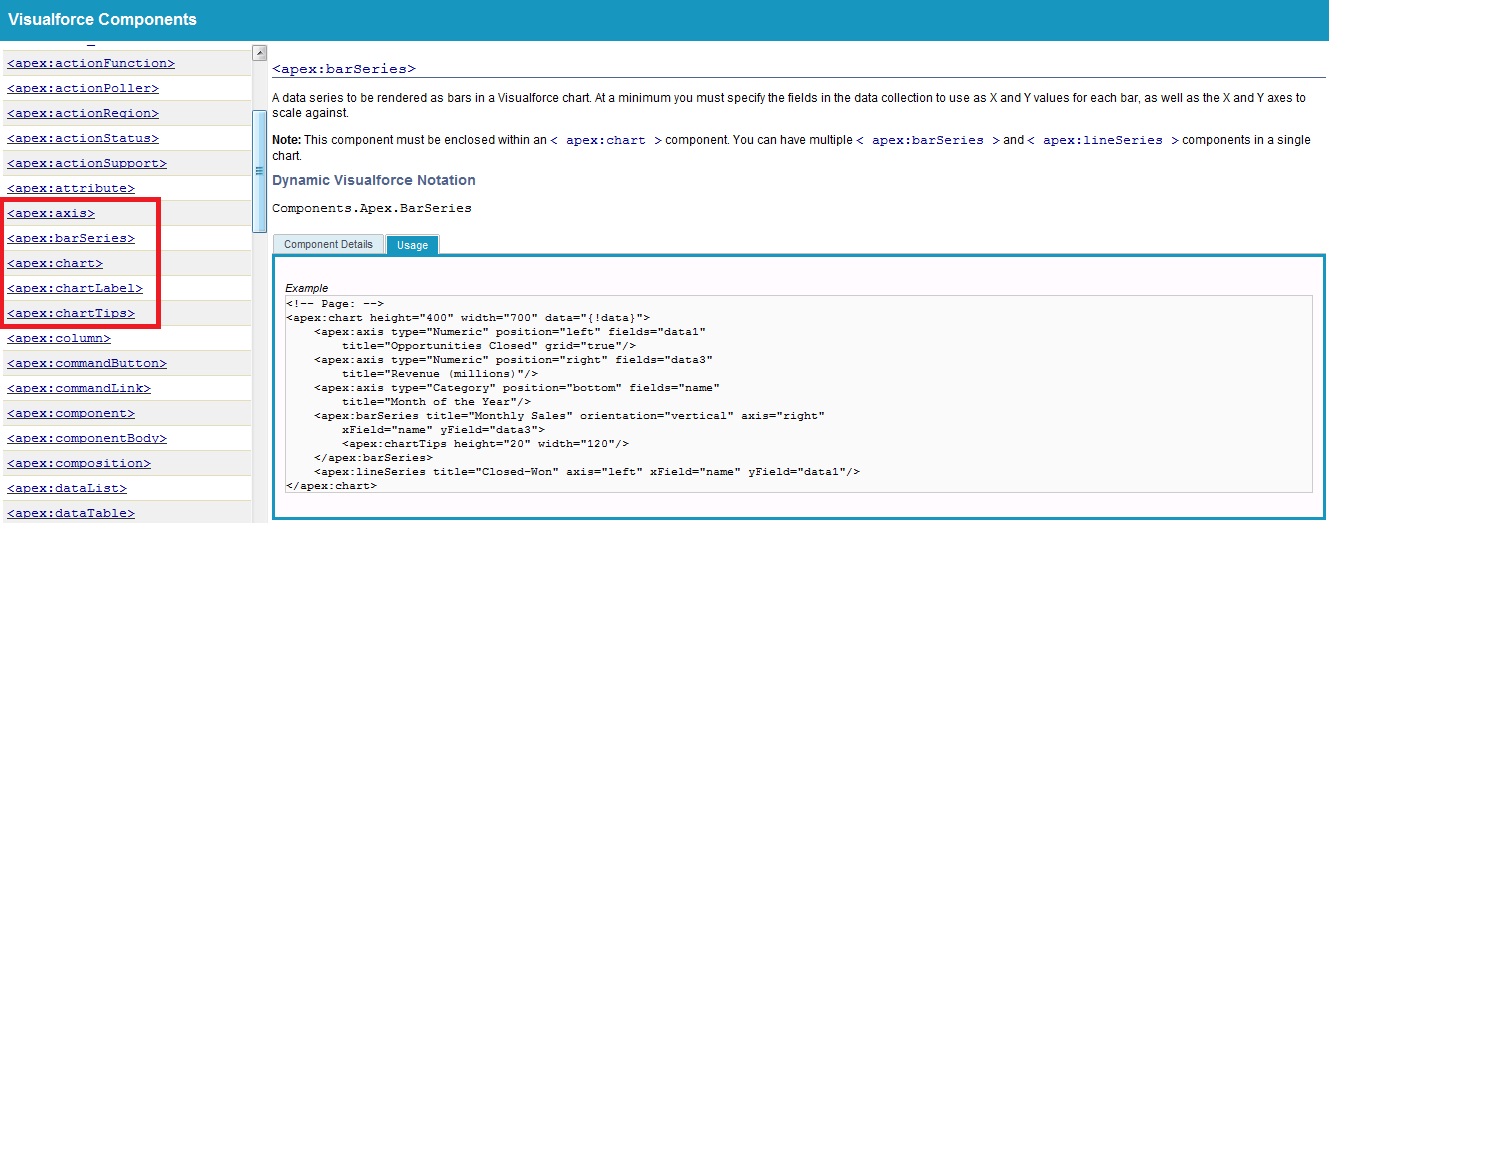
After enabling visualforce charting you are able to see the components in "Component Reference" which are used to create visualforce charts.


Right now if we need to display chart (pie,line,bar etc) we go for google charts, any charts or any third party charts. But with winter 12 release visualforce charting (pilot) is a way for you to create custom charts on your Visualforce pages(pie, bar, and line charts). Visualforce charts are rendered client-side using JavaScript. This allows charts to be animated and visually exciting, and chart data can load and reload asynchronously, which can make the page feel more responsive.


Right now visualforce charting offers variations on bar, line, and pie charts but if you like to use other charts then you can go with Google Charts


Limitations (As it is in pilot there are some limitation too)


  • Visualforce charts will only render in browsers which support scalable vector graphics (SVG).
  • Visualforce charting uses JavaScript to draw the charts. These charts won't display in pages rendered as PDFs.
  • Email clients do not generally support JavaScript execution in messages. Don't use Visualforce charting in email messages or email templates.
  • Visualforce charting sends errors and messages to the JavaScript console. You'll want to keep a JavaScript debugging tool, such as Firebug, active during development.


Creating a chart with Visualforce will require you to do two things:


  1. Write an Apex method that queries for, calculates, and wraps your chart data to send to the browser.
  2. Define your chart using the Visualforce charting components.


When the page containing the chart loads, the chart data is bound to a chart component, and the JavaScript that will draw the chart is generated. When the JavaScript executes, the chart is drawn in the browser. A Visualforce chart requires that you create a chart container component, which encloses at least one data series component.


Here is the simple example of using Pie Chart :


VFP :
<apex:page controller="PieChartController" title="Pie Chart"> 

    <apex:chart height="350" width="450" data="{!pieData}">
        <apex:pieSeries dataField="data" labelField="name"/>
        <apex:legend position="top"/>
    </apex:chart>

</apex:page>
Class :

public class PieChartController
{
    //For Pie Chart
    public List<PieWedgeData> getPieData()
    {
        List<PieWedgeData> data = new List<PieWedgeData>();
        data.add(new PieWedgeData('Jan', 30));
        data.add(new PieWedgeData('Feb', 15));
        data.add(new PieWedgeData('Mar', 10));
        data.add(new PieWedgeData('Apr', 20));
        data.add(new PieWedgeData('May', 20));
        data.add(new PieWedgeData('Jun', 5));
        return data;
    }

    // Wrapper class for Pie Chart
    public class PieWedgeData
    {
        public String name { get; set; }
        public Integer data { get; set; }

        public PieWedgeData(String name, Integer data) {
            this.name = name;
            this.data = data;
        }
    }
}

Resulting page looks like this :


Example of more complex Charts :


VFP :
<apex:page controller="ChartController">
    <apex:chart height="400" width="700" data="{!data}">
        <apex:legend position="right"/>
        <apex:axis type="Numeric" position="left" fields="data1"
            title="Opportunities Closed" grid="true"/>
        <apex:axis type="Numeric" position="right" fields="data3"
            title="Revenue (millions)"/>
        <apex:axis type="Category" position="bottom" fields="name"
            title="Month of the Year">
            <apex:chartLabel rotate="315"/>
        </apex:axis>
        <apex:barSeries title="Monthly Sales" orientation="vertical" axis="right"
            xField="name" yField="data3">
            <apex:chartTips height="20" width="120"/>
        </apex:barSeries>
        <apex:lineSeries title="Closed-Won" axis="left" xField="name" yField="data1"
            fill="true" markerType="cross" markerSize="4" markerFill="#FF0000"/>
        <apex:lineSeries title="Closed-Lost" axis="left" xField="name" yField="data2"
            markerType="circle" markerSize="4" markerFill="#8E35EF"/>
    </apex:chart>
</apex:page>
Class :

public class ChartController {
    // Return a list of data points for a chart
    public List<Data> getData() {
        List<Data> data = new List<Data>();
        data.add(new Data('Jan', 30, 90, 55));
        data.add(new Data('Feb', 44, 15, 65));
        data.add(new Data('Mar', 25, 32, 75));
        data.add(new Data('Apr', 74, 28, 85));
        data.add(new Data('May', 65, 51, 95));
        data.add(new Data('Jun', 33, 45, 99));
        data.add(new Data('Jul', 92, 82, 60));
        data.add(new Data('Aug', 87, 73, 45));
        data.add(new Data('Sep', 34, 65, 55));
        data.add(new Data('Oct', 78, 66, 56));
        data.add(new Data('Nov', 80, 67, 53));
        data.add(new Data('Dec', 17, 70, 70));
        return data;
    }

    // Wrapper class
    public class Data {
        public String name { get; set; }
        public Integer data1 { get; set; }
        public Integer data2 { get; set; }
        public Integer data3 { get; set; }
        public Data(String name, Integer data1, Integer data2, Integer data3) {
            this.name = name;
            this.data1 = data1;
            this.data2 = data2;
            this.data3 = data3;
        }
    }
}

Resulting page looks like this :


As it is in pilot, so will soon come up with more real time examples and scenarios, stay tuned.


More Reference :
Quick Look at Visualforce Charting
Building a Complex Chart with Visualforce Charting
How Visualforce Charting Works

Jun 19, 2011

Summer 11 Features - Part 2 (JavaScript Remoting)

One of the major enhancements from visualforce this release(Summer 11) and my favorite is JavaScript remoting.


JavaScript Remoting is the ability to invoke apex class method from javascript embedded in a visualforce page. JavaScript Remoting is now available after summer 11 release.


Here is a quick example : we have a Apex class which defines a get Account method.
global with sharing class MyJSRemoting
{
    public static Account account { get; set; }
     
    @RemoteAction
    global static Account getAccount(String accountName) {
        account = [select id, name, phone, type, numberofemployees from 
             Account where name = :accountName limit 1];
        return account;
    }   
}
This method is having @RemoteAction annotation making it available to be called from a visualforce page. Now in our visualforce page we have a script tag set which is how we embed javascript within visualforce pages.


This JavaScript code then invokes the getAccount method in the apex class to take action.


Please note I have used namespace "ankit.MyJSRemoting" as there is a namespace registered on my organization.

JavaScript Remoting is the feature which is primarily be used by developers and will allow them to create richer and more interactive user interfaces that everyone will benefit from.

In particular, lets developers create rich javascript based user interfaces by invoking apex controller methods within JavaScript code. JavaScript is typically used to render small parts of user interface. Result from a Javascript remoting call are much faster then using a typical visualforce reRender model, developers can provide more instant feedback to the user. This is because remoting calls are stateless. Means only data is set back and forth instead a lot of bulky HTML.

Additional Visualforce enhancements :

1) Filtered Lookup via Visualforce.
2) Inline editing for rich text area field.
3) Field Set property accessors.

Summer 11 Features - Part 1 (Enhanced Profile User Interface)

Enhanced Profile User Interface brings a new way of creating, editing and viewing user profiles. Existing profile interface groups together settings and permission by type in a long scrolling detail page for example page layout assignment for all object are grouped in one section, field level security settings in another and object permissions in another. This involves a lot of scrolling and visits to modify multiple sections.


How to enable "Enhanced Profile User Interface" : Set Up > App Set Up > Customize > User Interface > Check "Enable Enhanced Profile User Interface"


Enabling enhanced profile user interface addresses these limitations which provides a clean overview page from where you can easily access the setting and permissions you need.


For example "Find Setting" box at the top let you quickly find the objects tabs and permissions you want to view or modify.


Similarly "Apps" and "System" section have different gain grounds.


Key benefits of enhanced profile user interface :


1) Quickly find individual settings and permissions (Using Find Settings at top)
2) Easily set up profiles for users with a particular job role.
3) Quickly modify settings and permissions for new custom objects


Cheers

Jan 27, 2011

Spring 11 Release - Revised Governor Limits

Hi All,

Some interesting changes introduced in spring 11 release in Governor Limits are as follows :

1) The total number of DML statements issued for a process has gone from 20 for triggers, and 100 for everything else, to 150 for all contexts.

2) Total number of records retrieved by SOQL queries has gone from 10,000 to 50,000 .

Note : But standard set controller will accept 10,000 records only.

3) The limit on the number of items returned by the findSimilar method has been eliminated.

 Thanks